Implementing k-means clustering from scratch in C++
I have a somewhat complicated history when it comes to C++. When I was 15 and teaching myself to code, I couldn’t decide between python and C++ and as a result tried to learn both at the same time. One of my first non-trivial projects was a C++ program to compute orbits – looking back on it now, I can see that what I was actually doing was a (horrifically inefficient) implementation of Euler’s method. I just couldn’t wrap my head around fixed-size arrays (not to mention pointers!). In any case, I soon realised that juggling C++ and python was untenable – not only was I new to the concepts (such as type systems and OOP), I was having to learn two sets of syntax in addition to two flavours of these concepts. I decided to commit to python and haven’t really looked back since.
Now, almost 6 years later (tempus fugit!), having completed the first-year computer science course at Cambridge, I feel like I am in a much better place to have a proper go at C++. My motivation is helped by the fact that all of the second-year computational practicals for physics are done in C++, not to mention that C++ is incredibly useful in quantitative finance (which I am deeply interested in).
To that end, I decided to jump straight in and implement a machine learning algorithm from scratch. I chose k-means because of its personal significance to me: when I was first learning about ML, k-means was one of the first algorithms that I fully grokked and I spent quite a while experimenting with different modifications and implementations in python. Also, given that the main focus of this post is to learn C++, it makes sense to use an algorithm I understand relatively well.
Please let me add the disclaimer that this is certainly not going to be an optimal solution – this post is very much a learning exercise for me and I’d be more than happy to receive constructive criticism. As always, all code for this project can be found on GitHub.
Contents
What is k-means clustering?
I have decided to give four brief explanations with increasing degrees of rigour. Nothing beyond the first explanation is really essential for the rest of this post, so feel free to stop whenever.
- k-means clustering allows us to find groups of similar points within a dataset.
- k-means clustering is the task of finding groups of points in a dataset such that the total variance within groups is minimised.
- k-means clustering is the task of partitioning feature space into k subsets to minimise the within-cluster sum-of-square deviations (WCSS), which is the sum of quare euclidean distances between each datapoint and the centroid.
- Formally, k-means clustering is the task of finding a partition $S = \{S_1, S_2, \ldots S_k\}$ where $S$ satisfies:
The k-means algorithm
The k-means clustering problem is actually incredibly difficult to solve. Let’s say we just have $N=120$ and $k=5$, i.e we have 120 datapoints which we want to group into 5 clusters. The number of possible partitions is more than the number of atoms in the universe ($5^{120} \approx 10^{83}$) – for each one, we then need to calculate the WCSS (read: variance) and choose the best partition.
Clearly, any kind of brute force solutions is intractable (to be specific, the problem has exponential complexity). Hence, we need to turn to approximate solutions. The most famous approximate algorithm is Lloyd’s algorithm, which is often confusingly called the “k-means algorithm”. In this post I will silence my inner pedant and interchangeably use the terms k-means algorithm and k-means clustering, but it should be remembered that they are slightly distinct. With that aside, Lloyd’s algorithm is incredibly simple:
1. Initialise the clusters
The algorithm needs to start somewhere, so we need to come up with a crude way of clustering points. To do this, we randomly select k points which become ‘markers’, then assign each datapoint to its nearest marker point. The result of this is k clusters. While this is a naive initialisation method, it does have some nice properties - more densely populated regions are more likely to contain centroids (which makes logical sense).
2. Compute the centroid of each cluster
Technically Lloyd’s algorithm computes the centroid of each partition of 3D space via integration, but we use the reasonable approximation of computing the centre of mass of the points in a given partition. The rational behind this is that the centroid of a cluster ‘characterises’ the cluster in some sense.
3. Assign each point to the nearest centroid and redefine the cluster
If a point currently in cluster 1 is actually closer to the centroid of cluster 2, surely it makes more sense for it to belong to cluster 2? This is exactly what we do, looping over all points and assigning them to clusters based on which centroid is the closest.
4. Repeat steps 2 and 3
We then repeatedly recompute centroids and reassign points to the nearest centroid. There is actually a very neat proof that this converges: essentially, there is only a finite (though massive) number of possible partitions, and each k-means update at least improves the WCSS. Hence the algorithm must converge.
Implementation
Our goal today is to implement a C++ version of the k-means algorithm that successfully clusters a two-dimensional subset of the famous mall customers dataset (available here). It should be noted that the k-means algorithm certainly works in more than two dimensions (the Euclidean distance metric easily generalises to higher dimensional space), but for the purposes of visualisation, this post will only implement k-means to cluster 2D data. A plot of the raw data is shown below:
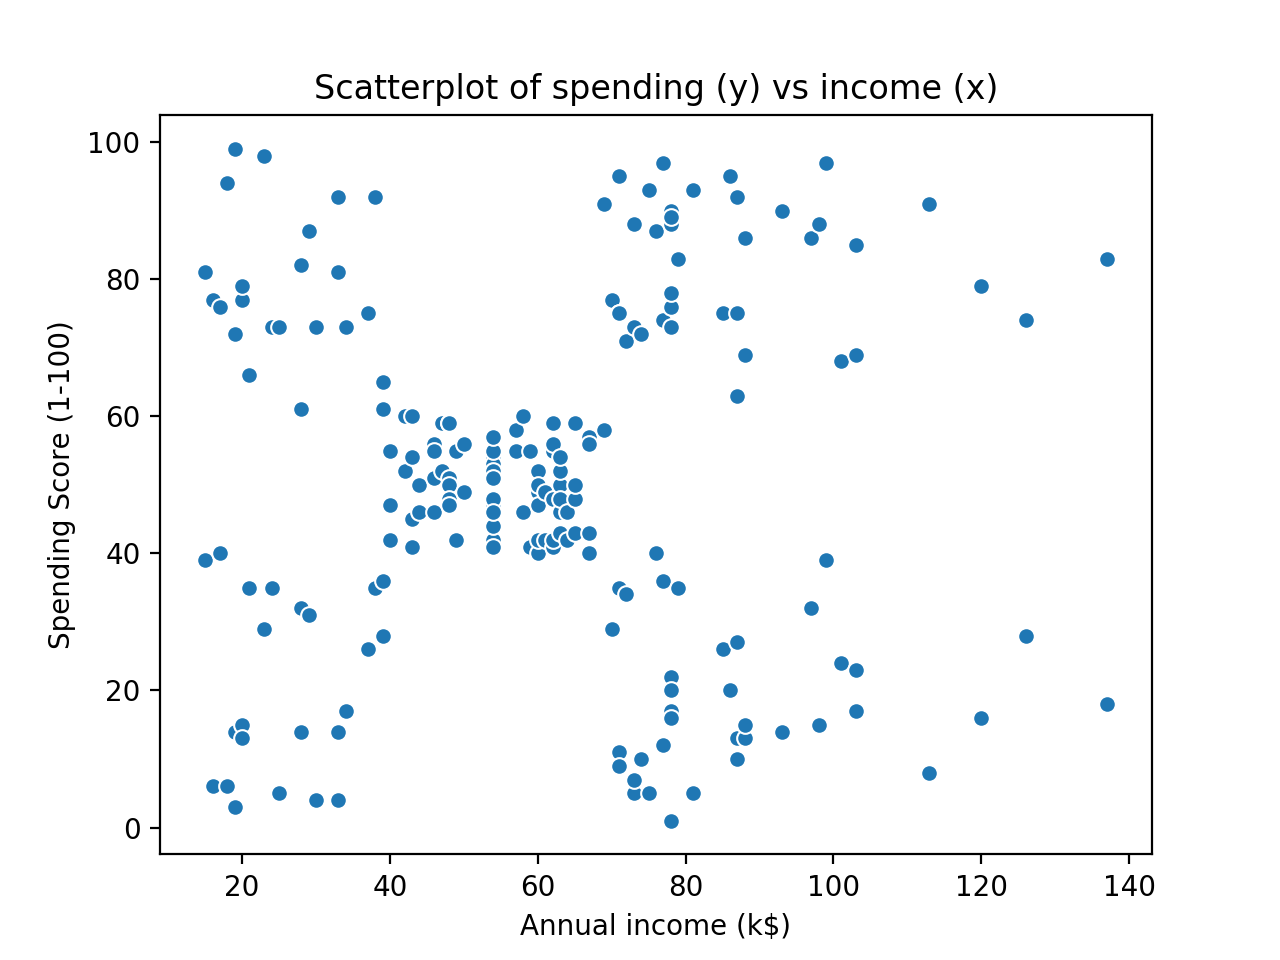
By eye, it seems that there are five different clusters. The question is whether our k-means algorithm can successfully figure this out. We are actually going to cheat a little bit and tell the algorithm that there will be five clusters (i.e $k=5$). There are methods to avoid this, but they essentially involve testing different values of k and finding the best fit, so they don’t add much value to this post.
C++ preambles
Firstly, we need to define our imports and namespace.
#include <ctime>     // for a random seed
#include <fstream>   // for file-reading
#include <iostream>  // for file-reading
#include <sstream>   // for file-reading
#include <vector>

using namespace std;
In general, using namespace std is not considered best practice (particularly in larger projects) because it can lead to ambiguity (for example, if I define a function or variable called vector) and unexpected behaviour. However, the alternative is to have things like std::cout or vector::vector everywhere – for an educational post, the loss in clarity is worse than the potential ambiguity.
Representing a datapoint
To represent a datapoint for this program, we will be using a C++ struct. Structs caused me a great deal of confusion when I was learning about C++ because I couldn’t quite figure out how they differ from classes. As it happens, they are really quite similar – possibly the only relevant difference is that members of a struct are public by default. In any case, I would think of a struct as a way of defining a more complicated data type, though it is more than just a container for primitive datatypes because you can also define some functionality.
struct Point {
    double x, y;     // coordinates
    int cluster;     // no default cluster
    double minDist;  // default infinite dist to nearest cluster

    Point() :
        x(0.0),
        y(0.0),
        cluster(-1),
        minDist(__DBL_MAX__) {}

    Point(double x, double y) :
        x(x),
        y(y),
        cluster(-1),
        minDist(__DBL_MAX__) {}

    double distance(Point p) {
        return (p.x - x) * (p.x - x) + (p.y - y) * (p.y - y);
    }
};
The first few lines are self-explanatory: we define the coordinates of a point, as well as the cluster it belongs to and the distance to that cluster. Annoyingly, you can’t directly set the default value in the struct (e.g. double x = 0) – you need to do this via initialisation lists. Initially the point belongs to no cluster, so we arbitrarily set that to -1. Accordingly, we must set minDist to infinity (or the next best thing, __DBL_MAX__).
We also define a distance function, which computes the (square) euclidean distance between this point and another. Our Point struct can be used as follows:
// Define new point at the origin
Point p1 = Point(0.0, 0.0);
cout << p1.x << endl;  // print the x coordinate

// Define another point and compute square distance
Point p2 = Point(3.0, 4.0);
cout << p1.distance(p2) << endl;  // prints 25.0
If we wanted to represent a datapoint in p-dimensions, we could replace the x and y members with a vector or array of doubles, with each entry corresponding to a coordinate in a given dimension. The distance function would similarly need to be modified to loop over the vectors/arrays and sum all of the squared differences.
Reading in data from a file
Having decided how we are going to store datapoints within our C++ script, we must then read in the data from a CSV file. This is rather unexciting, but actually took me a long time to figure out. Essentially, we loop over all the lines in the CSV file and break them down based on the commas.
vector<Point> readcsv() {
    vector<Point> points;
    string line;
    ifstream file("mall_data.csv");

    while (getline(file, line)) {
        stringstream lineStream(line);
        string bit;
        double x, y;
        getline(lineStream, bit, ',');
        x = stof(bit);
        getline(lineStream, bit, '\n');
        y = stof(bit);

        points.push_back(Point(x, y));
    }
    return points;
}
Note that the readcsv function returns a vector of points. I decided to use a vector instead of an array because vectors handle all of the memory management for you (though are slightly less performant) and are functionally quite similar to python lists.
Pointers: an old enemy revisited
Suppose your friend wants to visit your house. You have two options (the relevance of this thought experiment will be clear shortly.)
- Give them your postcode and let them find your house.
- Hire a team of builders to replicate your house brick-for-brick right outside their front door.
The readcsv function returns a vector of points. One might assume that we can then just pass this to whatever k-means function we define and be done with it.
vector<Point> points = readcsv();  // read from file
kMeansClustering(points);          // pass values to function
However, we must be aware that depending on the size of our dataset, points might take up quite a large chunk of memory, so we must handle it carefully to be efficient. The problem with the above code is that we are passing the values of the points to the function, i.e we are making a copy of them. This is inefficient from a memory perspective. Luckily, C++ offers a way around this, called pass by reference. Essentially, instead of giving the value of the points vector to the function, we pass the location (read: postcode) of the points vector in memory.
vector<Point> points = readcsv();
kMeansClustering(&points); // pass address of points to function
The prototype of our kMeansClustering function is then as follows:
void kMeansClustering(vector<Point>* points, int epochs, int k);
Because we are now passing an address (and thus not technically a vector<Point>), we must include an asterisk. Read the first argument as “a reference to a vector of Point objects”.
I have also added two other arguments:
epochsis the number of iterations over which we will do our main k-means loopkis the number of clusters.
Initialising the clusters
We first need to assign each point to a cluster. The easiest way of doing this is to randomly pick 5 “marker” points and give them labels 1-5 (or actually 0-4 since our arrays index from 0).
The code for this is quite simple. We will use another vector of points to store the centroids (markers), where the index of the centroid is its label. We then select a random point from the points vector we made earlier (from reading in the csv) and set that as a centroid.
vector<Point> centroids;
srand(time(0));  // need to set the random seed
for (int i = 0; i < k; ++i) {
    centroids.push_back(points->at(rand() % n));
}
One brief C++ note: because points is actually a pointer rather than a vector, in order to access an item at a certain index we can’t do points[i] – we have to first ‘dereference’ it by doing (*points)[i]. This is quite ugly, so fortunately we have the syntactic shortcut of: points->at[i].
Once the centroids have been initialised, we can begin the k-means algorithm iterations. We now turn to the “meat” of k-means: assigning points to a cluster and computing new centroids.
Assigning points to a cluster
The logic here is quite simple. We loop through every datapoint and assign it to its nearest centroid. Because there are k centroids, the result is a partition of the datapoints into k clusters.
In terms of the actual code, I had to spend some time thinking about the best way to represent that a point belonged to a certain cluster. In my python implementation (now many years old), I used a dictionary with cluster IDs as keys and a list of points as values. However, for this program I decided to use a quicker solution: I gave each point a cluster attribute which can hold an integer ID. We then set this ID to the index of the cluster that is closest to the point.
for (vector<Point>::iterator c = begin(centroids);
     c != end(centroids); ++c) {
    // quick hack to get cluster index
    int clusterId = c - begin(centroids);

    for (vector<Point>::iterator it = points->begin();
         it != points->end(); ++it) {

        Point p = *it;
        double dist = c->distance(p);
        if (dist < p.minDist) {
            p.minDist = dist;
            p.cluster = clusterId;
        }
        *it = p;
    }
}
Computing new centroids
After our first iteration, the clusters are really quite crude – we’ve randomly selected 5 points then formed clusters based on the closest random point. There’s no reason why this should produce meaningful clusters and indeed it doesn’t. However, the heart of k-means is the update step, wherein we compute the centroids of the previous cluster and subsequently reassign points.
As previously stated, we are going to majorly simplify the problem by computing the centroid of the points within a cluster rather than the partition of space. Thus all we really have to do is compute the mean coordinates of all the points in a cluster.
To do this, I created two new vectors: on to keep track of the number of points in each cluster and the other to keep track of the sum of coordinates (then the average is just the latter divided by the former).
vector<int> nPoints;
vector<double> sumX, sumY;

// Initialise with zeroes
for (int j = 0; j < k; ++j) {
    nPoints.push_back(0);
    sumX.push_back(0.0);
    sumY.push_back(0.0);
}
We then iterate through all the points and increment the correct indices of the above vectors (based on the point’s cluster ID). Importantly, now is a convenient time to reset the minDist attribute of the point, so that the subsequent iteration works as intended.
// Iterate over points to append data to centroids
for (vector<Point>::iterator it = points->begin();
     it != points->end(); ++it) {
    int clusterId = it->cluster;
    nPoints[clusterId] += 1;
    sumX[clusterId] += it->x;
    sumY[clusterId] += it->y;

    it->minDist = __DBL_MAX__;  // reset distance
}

// Compute the new centroids
for (vector<Point>::iterator c = begin(centroids);
     c != end(centroids); ++c) {
    int clusterId = c - begin(centroids);
    c->x = sumX[clusterId] / nPoints[clusterId];
    c->y = sumY[clusterId] / nPoints[clusterId];
}
Now that we have the new centroids, the k-means algorithm repeats. We recompute distances and reassign points to their nearest centroids. Then we can find the new centroids, recompute distances etc..
Writing to a file
One final detail: after all of our k-means iterations, we would like to be able to write the output to a file so that we can analyse the clustering. This is quite simple - we will just iterate through the points then print their coordinates and cluster IDs to a csv file.
ofstream myfile;
myfile.open("output.csv");
myfile << "x,y,c" << endl;

for (vector<Point>::iterator it = points->begin();
     it != points->end(); ++it) {
    myfile << it->x << "," << it->y << "," << it->cluster << endl;
}
myfile.close();
Testing
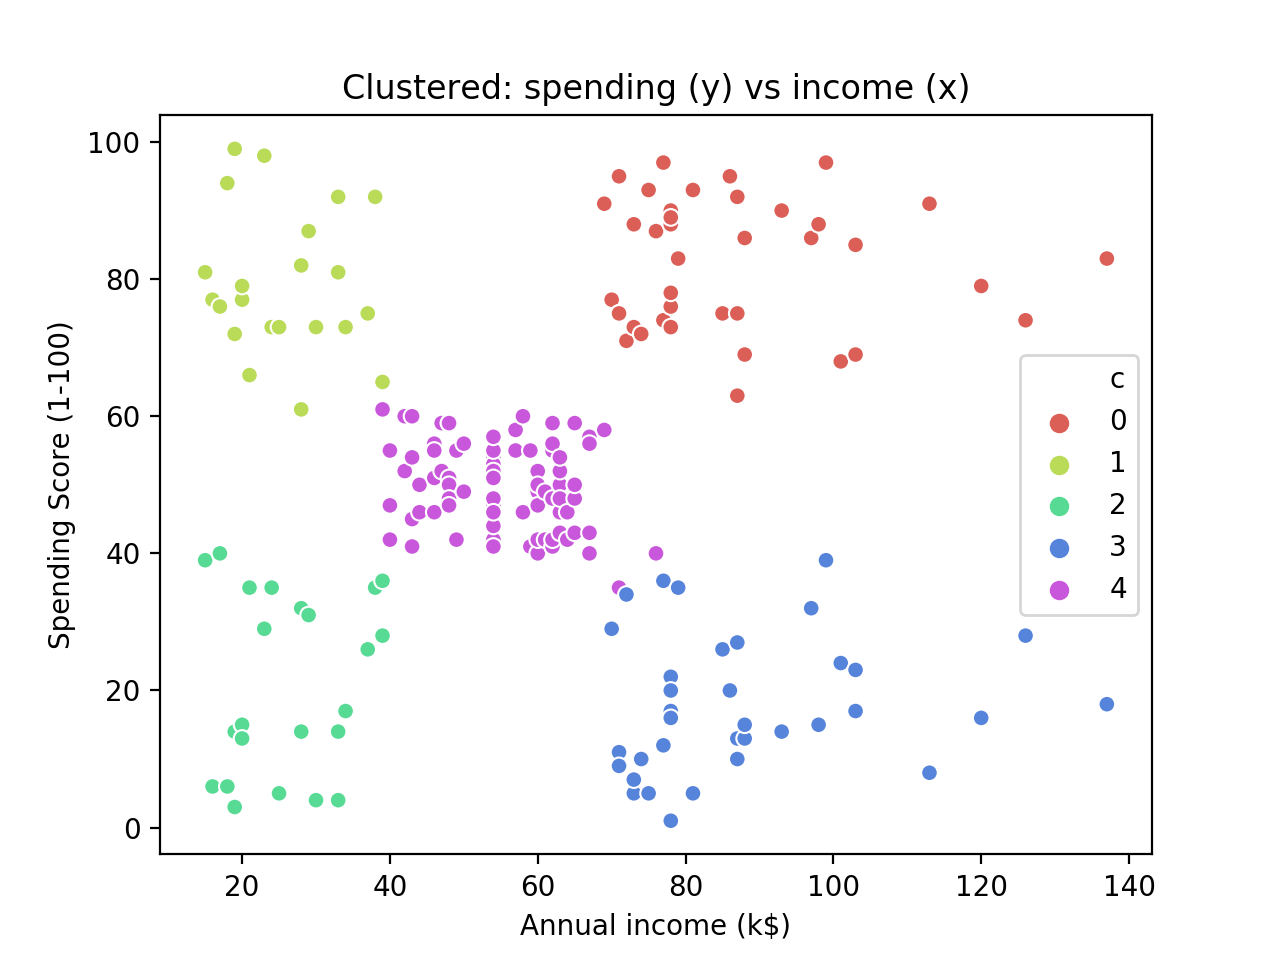
In order to test that my k-means implementation was working properly, I wrote a simple plotting script. I am somewhat embarrassed (in the context of a C++ post) to say that I wrote this in python.
import matplotlib.pyplot as plt
import pandas as pd
import seaborn as sns

# Before clustering
df = pd.read_csv("mall_data.csv", header=None)
df.columns = ["Annual income (k$)", "Spending Score (1-100)"]
sns.scatterplot(x=df["Annual income (k$)"],
                y=df["Spending Score (1-100)"])
plt.title("Scatterplot of spending (y) vs income (x)")

# After clustering
plt.figure()
df = pd.read_csv("output.csv")
sns.scatterplot(x=df.x, y=df.y,
                hue=df.c,
                palette=sns.color_palette("hls", n_colors=5))
plt.xlabel("Annual income (k$)")
plt.ylabel("Spending Score (1-100)")
plt.title("Clustered: spending (y) vs income (x)")

plt.show()
The result is quite pretty and it shows that – bar a few contentious points around the centre cluster – the clustering has worked as expected.
Conclusion
In conclusion, we have successfully implemented a simple k-means algorithm in C++. Obviously there is much that could be improved about my program. Firstly, many simplifications were made, for example, we restricted the problem to two dimensions and also pre-set the number of clusters. However, there are more subtle issues that we neglected to discuss, including the random initialisation which may result in suboptimal clusters. In fact, there are algorithms like k-means++ that offer major improvements over k-means by specifying better procedures to find the initial clusters.
It is also worth mentioning the fundamental difficulties with k-means: it acutely suffers from the ‘curse of dimensionality’, as data becomes more sparse in high dimensions, and it is relatively inefficient since there are four loops (over iterations, points, clusters, and dimensions). However, k-means is often a great solution for quickly clustering small data and the algorithm is just about simple enough to explain to business stakeholders.
In any case, the merits/disadvantages of k-means aside, writing this program has given me a lot more confidence in C++ and I am keen to develop a more advanced understanding. I think it’s a good complement to my current interests in scientific/financial computing and it is pleasing to see that I am making more progress than I was a few years back.