Understanding the market's expectations of COVID-19
One of the reasons why I find markets fascinating is that they are capable of integrating huge amounts of information, misinformation, hope, fear and uncertainty into a single number – the price of an asset. In this post, we work backwards, quantitatively examining what the current price of an asset can tell us about its future prospects.
The importance of expectations
For an investment to be successful, it is not enough that you make a correct prediction. You must make a correct prediction that hasn’t already being priced in by the market. Amateur investors quickly realise that buying Google stock because “everyone uses Google!” is a bad idea – the market realised the same thing long ago and has therefore rewarded Google with a share price that is 25 times its annual earnings.
The mechanism for this is as follows: assuming an efficient market (we will comment on this assumption later), if market participants expect a company’s earnings to go up next year, they will buy the stock in advance. So once all market participants have formulated and traded on their views, the market price of the asset encodes future expectations for earnings (or to be precise, cash flows).
To make a successful investment, it really helps to have some idea of what these expectations are so that you can understand whether or not your perspectives deviate from consensus. Only then will you be able to profit – if your deviant perspective is correct.
Price-implied expectations
Unfortunately, although we have just argued that the current price incorporates expectations, the reverse procedure of figuring out the expectations implied by a price is not trivial. Imagine I have a basket of fruit containing some apples and bananas (quantities A and B respectively). I tell you that there are 5 pieces of fruit in the basket. How many apples do I have?
Obviously, there isn’t a (unique) answer to this question because I haven’t given you enough information. There are two unknowns (A and B), but only one equation relating them, $A + B = 5$.
This silly analogy goes quite far in explaining the difficulty of working out the price-implied expectations. There are many variables that determine a stock price, e.g. future sales growth, profit margins, reinvestment rates, interest rates – and for each of these variables, market expectations matter. In the same way that knowing the total quantity of fruit was insufficient to calculate the number of apples, the price is insufficient to calculate the expectation for a particular variable, like the future sales growth.
However, although in the fruit example we weren’t able to calculate a unique value of A or B, we were able to restrict the possibilities to those values of A and B that satisfy $A+ B = 5$. This relationship can be visualised as a straight line in “fruit space”:
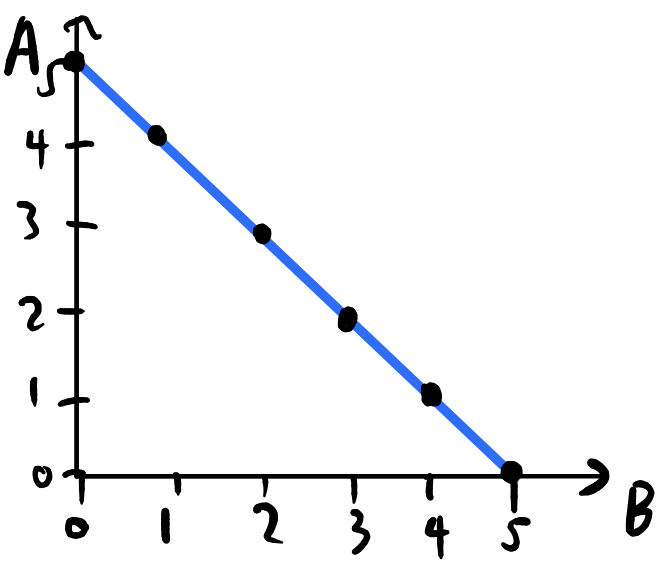
We will revisit this idea in due course. However, we must first understand how assets are priced (how the total number of fruits in the basket is related to the numbers of apples and bananas).
Discounted Cash Flows (DCFs)
Would you rather have \$1000 today or \$1000 a year from now? The correct answer is to take the \$1000 today because you can invest it and earn some return on it. Following on from that, we can calculate how much a guaranteed \$1000 n years from now should be worth to us today, in other words, the present value of the \$1000:
\[PV = \frac{1000}{(1+i)^n}\]Here, i is the “discount rate”, equal to the rate of return you could get on an asset of similar risk. In the above example, we would use the risk-free rate since I said that the \$1000 is guaranteed to be paid.
This simple formula is the heart of all intrinsic valuation methodologies, but it rapidly becomes more complicated when we deal with assets whose future cash flows are uncertain. In particular, there are many idiosyncrasies when it comes to valuing equities (i.e shares in companies).
- Corporate earnings are very different to cash flows.
- If we own an equity stake in a company, how much cash do we actually receive?
- Earnings and cash flows are anything but static – management can deploy capital effectively to improve future growth or conversely can make investments that are value-destructive.
In the next section, we discuss how some of these issues are resolved, to value the S&P500.
Valuing the S&P500
The S&P500 index consists of the largest 500 companies (measured by market capitalisation) in the US. When people are talking about how “the markets” are performing, more often than not they are referring to the S&P.
The framework I am using to value the S&P500 was built by Aswath Damodaran, the “Dean of Valuation”. A brief overview is given below, but I would encourage you to read his blog post (or watch the accompanying YouTube video).
Remember, at its core, a DCF only needs two things: future cash flows and a discount rate. To estimate the future cash flows of the S&P, we estimate the earnings growth in the next five years, as well as what fraction of earnings is returned to shareholders in the form of dividends and buybacks. The discount rate depends on the equity risk premium and the risk-free rate of return. At the end of year 5, the index has some terminal value that is calculated by assuming that the S&P grows in line with the economy in perpetuity.
The cash flow in year $n$ (for $n \leq 5$) can be written in terms of the base-year earnings $E_0$, the growth rates $g_n$, and the cash return fractions $f_n$:
\[CF_n = f_n \cdot E_0(1+g_0)(1+g_1)...(1+g_{n-1})\]The initial cash return fraction $f_0$ can be set to whatever number we want, but we will ensure that by year 5 they tend towards a stable long-term quantity.
The terminal value in year 5 depends on the perpetual growth rate $\tilde{g}$:
\[TV = \frac{CF_5 (1 + \tilde{g})}{(i - \tilde{g})}\]Hence the present value of the S&P index is:
\[PV = \sum_{n=1}^5 \frac{CF_n}{(1+i)^n} + \frac{TV}{(1+i)^5}\]The base-year earnings is a known quantity, and it is possible to find the consensus estimates of near-term growth rates $g_n$ online. Thus, plugging these numbers into the formula should give a value near the current price of the S&P500.
The effect of COVID-19
To model how COVID-19 affects the value of the index, we can think about how it changes the following variables:
- Fiscal year (FY) 2020 earnings growth – this will definitely take a hit as consumers spend less.
- Earnings growth in FY2021-2024 – this depends on the fraction of lost earnings that we think will be recouped in the subsequent years.
- The fraction of cash returned – companies may become more conservative and retain more cash, lowering the cash return fraction.
Damodaran argues that any effects on the discount rate are minimal because the decrease in the risk-free rate is offset by the increase in equity risk premiums. Also, as we will later verify, the fraction of cash returned is nowhere near as important as the first two variables (because regardless of the initial fraction, by the end of year 5 it converges to a stable value). Thus, we can make the approximation that price depends on two variables: the drop in FY20 earnings and the fraction of earnings recouped.
Here we have a minor problem: the model requires us to specify the earnings growth in FY21-24 – while this is indeed related to the fraction of earnings recouped, converting between the two is not trivial. It is intuitively clear that if you think a high fraction of earnings will be recouped, subsequent growth will have to be greater to make up for the lost earnings. But to quantify this, you essentially have to project out the cash flows under the pre-coronavirus consensus growth estimates ($g_0’ = 5.52\%$ in FY20 and $g’ = 3.36\%$ in FY21-24), with $1-f$ of the FY20 earnings lost permanently. The resulting formula is as follows, where $g_0$ (no dash) denotes our estimate of the FY20 earnings growth (negative since we are expecting a drop):
\[\hat{g} = \left[\left(1+f \cdot \frac{g_0' - g_0}{1 + g_0}\right)\cdot (1+g')^4\right]^{1/4} -1\]EDIT: thanks to Ryan Kho for pointing out that I had transcribed the formula incorrectly. The formula is not at all intuitive, so I have uploaded a spreadsheet to demonstrate where it comes from.
With this out of the way, we are now in a situation very similar to that of the fruit basket. We have two variables $f$ and $g_0$, that combine to form the price. Given the price alone, we do not have enough information to find either of $f$ and $g_0$, but we can certainly plot their relationship visually.
Python implementation
If you just want to see the results, feel free to skip over this section. In any case, there’s nothing particularly fancy going on – it’s just a python translation of the maths from above:
# Function to value the S&P given drop and growth.
def valuation(
    drop, growth,
    base_earnings = 163,
    f0 = 0.855,  # base cash return
    rf = 0.0134, # risk free rate
    erp = 0.0525,  # equity risk premium
    lt_growth = 0.0134,  # perpetual growth
    lt_roe = 0.15  # perpetual return on equity
):
    # Stable cash return fraction
    lt_f = 1 - lt_growth / lt_roe
    # Calculate discount factor 1/(1+i)
    discount_factor = 1/ (1 + rf + erp)

    pv = 0
    earnings = base_earnings
    for n in range(1, 6):
        if n == 1:
            earnings *= (1 + drop)
        else:
            earnings *= (1 + growth)
        ret_frac = f0 + n * (lt_f - f0)/5
        cash_flow = earnings * ret_frac
        pv += cash_flow * discount_factor ** n

    tv = earnings * (1 + lt_growth) * lt_f / (rf + erp - lt_growth)
    pv_terminal = tv * discount_factor ** 5

    return pv + pv_terminal

# Function to convert a recoupment fraction to growth rate
def recoup_to_growth(f, drop, g0=0.0552, g=0.0336):
    # confusingly, I have relabelled g0' as g0.
    return ((1+f*(g0-drop)/(1+drop))*(1+g)**4)**0.25-1

# Function to value the S&P given drop and recoupment fraction.
def valuation_recoup(drop, frac, **kwargs):
    return valuation(drop, recoup_to_growth(frac, drop), **kwargs)
To generate the data used in the plots:
import numpy as np

n_res = 100  # resolution
recoup = np.linspace(0, 1, n_res)
drop = np.linspace(-0.5, 0, n_res)

X, Y = np.meshgrid(recoup, drop)
Z = np.zeros((n_res, n_res))

for i, x in enumerate(recoup):
    for j, y in enumerate(drop):
        Z[i, j] = valuation_recoup(y, x)
The plots themselves were just made using matplotlib and the mplot3d toolkit.
Results
Since we have two independent variables, we need three dimensions to visualise how they affect the price:
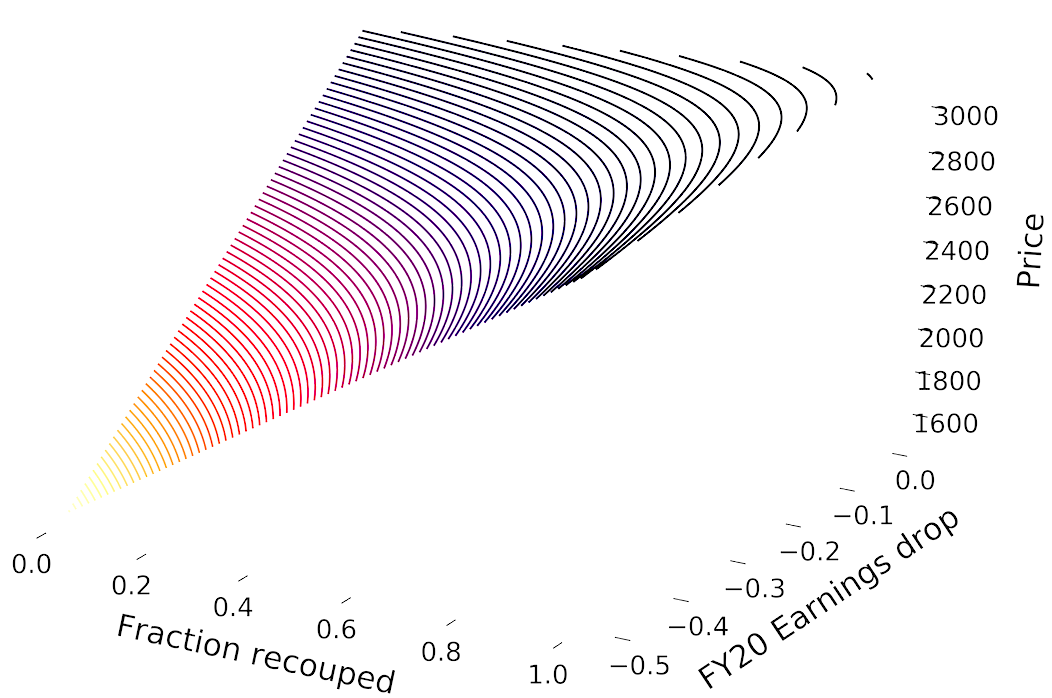
While this visualisation is pretty cool, it’s not that useful. We can sacrifice some of the visual appeal for utility by projecting it down onto two dimensions (i.e a contour plot):
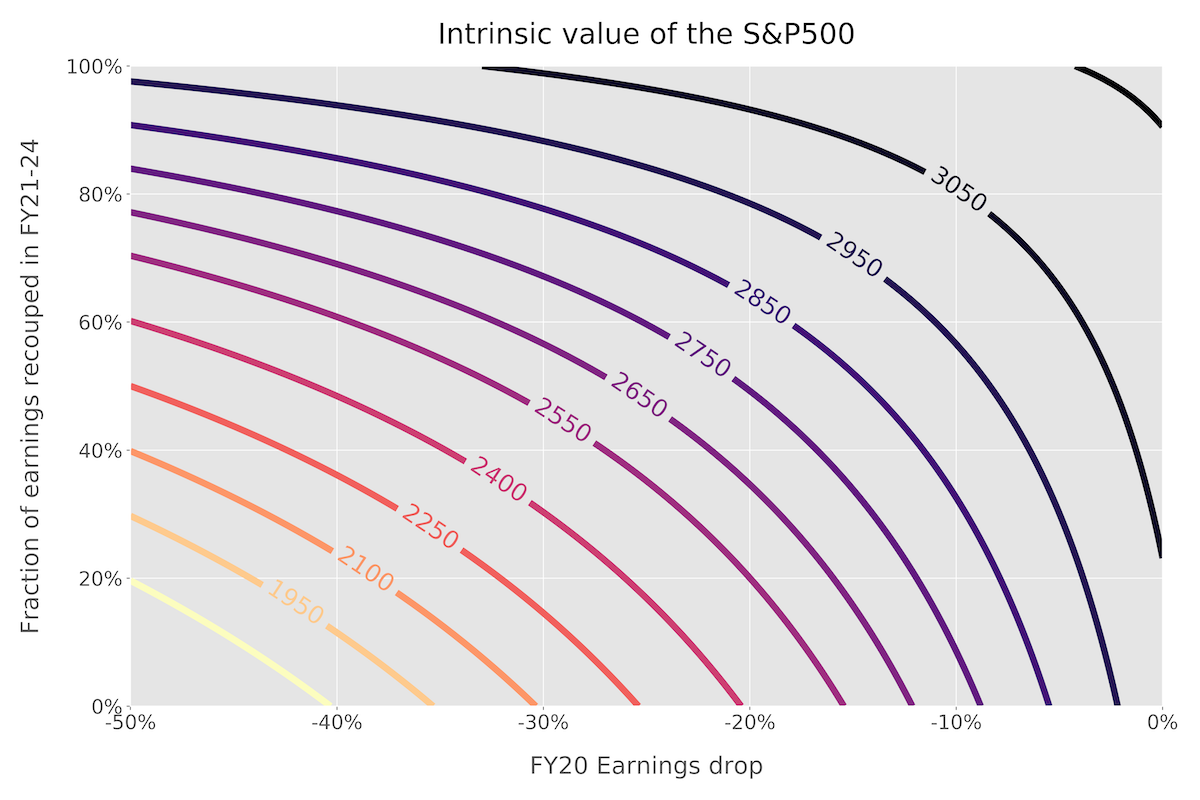
This chart might look daunting, but I want to stress that it’s the same concept as the original straight-line we had for apples and bananas, except with more lines so that we can see the relationship for different prices (“total number of fruits in the basket”).
There are several ways you can use this chart. Most obviously, you can use it to convert your estimates of the FY20 earnings drop and the fraction recouped into a price. For example, if you think that these values are -40% and 60% respectively, reading off the graph shows that the corresponding value of the S&P is \$2550.
However, the point of this post is to see what the current price is implying. As of 16/4/20, the S&P index is trading at about \$2783. This number is pretty close to \$2750, so let’s consider that contour for now. Specifically, the contour describes all possible combinations of earnings-drop and fraction-recouped that result in a value of \$2750. If, for example, you thought that earnings would drop -33% (as Goldman Sachs recently suggested), then the price-implied recoupment fraction is something like 75%. If you think this value of 75% is optimistic (and that Goldman’s estimate is accurate), the logical trade would be to short the S&P index.
You might be disappointed by the fact that there are only two levers you can play with (I personally think “the fewer the better”), but it turns out that these really are the most important variables. What about the cash return fraction? In the above plots, I have set it at 85%, the 10y average (much lower than the 92% returned in 2019). Let’s say you strongly disagree with this, in one of two ways:
- You think COVID-19 is going to be so terrifying that companies will reduce the return fraction to 2009-2010 levels of about 70%.
- You think the Fed’s bazooka will encourage companies to revert to their 2019 cash return fraction of 92%.
The plot below shows how much these differing assumptions (red and green respectively) affect the price contours (hint: very little).
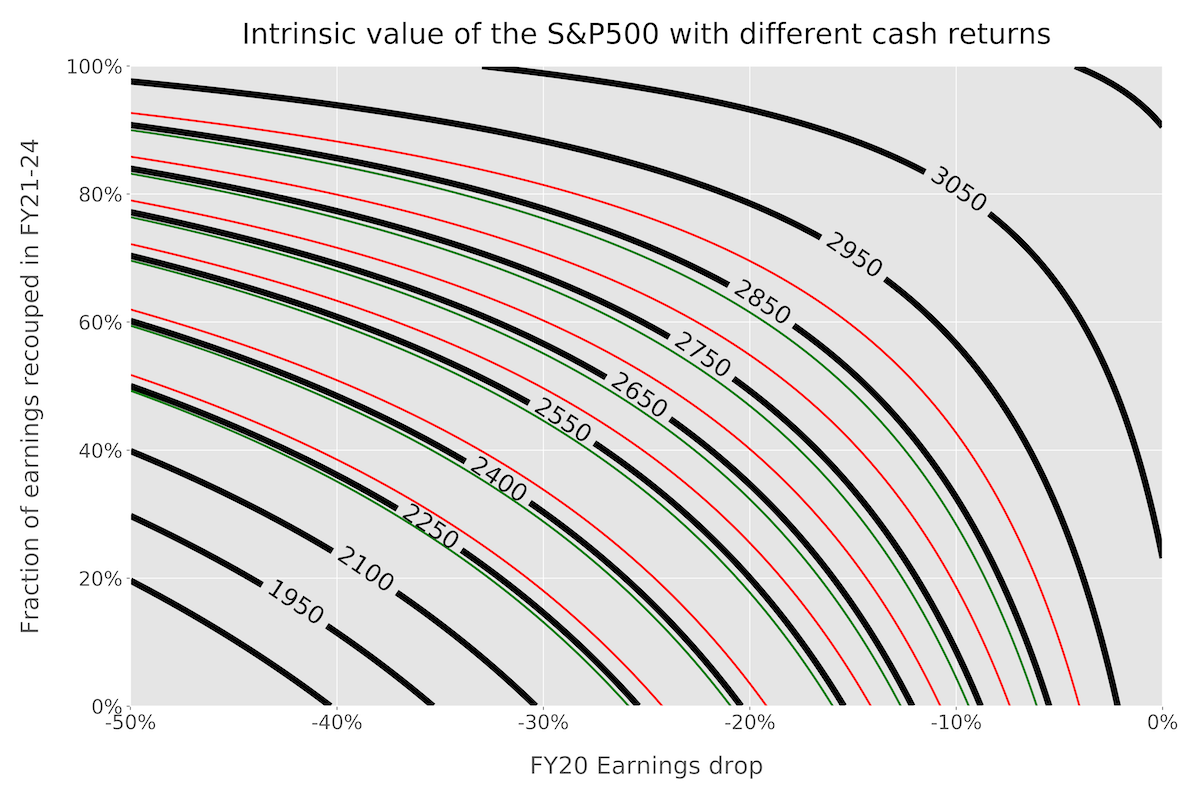
For example, taking a look at the new contours next to the original \$2750 curve, we see that these two major changes to the return fraction have only moved the price by about \$30 either way.
Conclusion
One of the underlying assumptions in this post is that markets are broadly efficient. Since the original work of Fama and French on the efficient market hypothesis (EMH) and the subsequent popularisation by books like A Random Walk Down Wall Street, there has been an increasing rift between the traditional academics, who happily apply the EMH to many problems and claim grand results, and the practitioners, who vehemently reject the EMH. But as Andrew Lo puts it in his book, Adaptive Markets, the truth is somewhere in between. The efficient market hypothesis is incorrect, but it is a very good first approximation. When market prices move, your first instinct should be that the price movement is justified by a change in expectations of future cash flows.
All this isn’t to say that markets can’t be wrong. But in fact, that is somewhat the point of this post. Between 19 Feb and 22 Mar, the S&P500 index dropped by 33%. Was this an overreaction? Or was it justified by the expectations of greatly diminished future earnings? With the above plot, you can quantitatively understand the “fair” value of the index given a certain combination of fundamentals. This post is clearly not offering a “magic formula” that tells you if something is overvalued or undervalued – rather, it is a first step in building the toolkit that allows you to even approach such questions.