A Tanker Trade
April 2020 has been a volatile month for oil. Last week, the May WTI contract traded at a low of minus \$40 a barrel. In a desperate search for storage space, people have been chartering oil tankers to use as floating storage units, leading to a price surge in shares of tanker companies like Nordic American Tanker (46%), Teekay (30%), and Scorpio Tankers (59%). In this post, we aim to build a framework for forecasting the revenue of DHT Holdings (NYSE:DHT), a tanker company.
The Excel models and accompanying python code are here. Please use them responsibly!
It takes two to contango
I am certainly not an expert on energy markets, but over the past couple of weeks, I’ve seen a lot of misinformation regarding oil prices. Since this is relevant to the content of this post, I want to briefly clarify a few of misunderstandings (cognisant of the fact that I probably have a few of my own).
- As a retail trader, it is very difficult for you to trade spot/physical oil. Instead, you might use oil futures, or more likely, an ETF like USO (which owns short-term futures). In usual times, USO does a decent job of tracking spot oil, so it’s a cheap way for you to get exposure to oil.
- Because of the coronavirus, there has been a massive demand shock. The resulting surplus in oil has lead to a lot of the storage capacity being filled up, resulting in a much higher storage cost.
- Futures contracts are thus more expensive the further out you go because they bake in the storage cost. This situation is known as contango, or in this case super contango owing to the magnitude of the effect.
- NYMEX WTI futures are physically settled, so when it comes to expiry, owning a long contract obligates you to receive delivery of 1000 barrels of oil. When the storage tanks are full, the piece of paper that gives you the right (and obligation) to receive oil becomes a liability – you are willing to give it away, or even pay someone to take it off your hands. Hence “negative oil prices”.
All this leads to the surprising fact that if you buy oil at \$5 a barrel and it trades at \$20 a barrel two months later, you have not quadrupled your investment. You might have actually lost money on this trade – it’s impossible to say with just the information I have given you since you need to factor in the cost of rolling your contract to the next month. When the futures curve is in super contango, this roll can be incredibly costly. We will later revisit this concept when we try to infer the storage cost from the futures curve.
Modelling revenue for DHT Holdings
The main goal of this post is to build a framework for forecasting the revenue of a tanker company. Though I don’t intend for this post to be a stock pitch, our discussion will be much more tangible in the context of a particular listed company. I decided on DHT Holdings because it is a pure-play on tankers: DHT owns 27 VLCCs (Very Large Crude Carriers – yes, that is their technical name) and their business does nothing but rent these out. In 2019, they had \$535m in revenue, all of which was from shipping. Of their expenses, less than 4% were administrative; everything else was related directly to the tankers. This makes the revenues rather easy to forecast in principle. If you know how much the daily rate that DHT charges you to charter a tanker you can multiply this by 365 days then by the number of tankers to ballpark their annual revenue.
The model essentially consists of an Excel spreadsheet containing estimates of the annual revenue contributions from each of the 27 tankers. The main complexity we will be accounting for in this simple model is that you can either time-charter a tanker, paying a fixed price to rent it for a longer period of time (6 months to a few years), or you can do a spot charter, renting the boat for a short period on short notice. As always, we turn to DHT’s most recent annual report (in particular, the notes to the financial statements therein), which provide a wealth of information regarding how DHT’s vessels were used in 2019.
Time-charters
As of the end of 2019, some of DHT’s ships had already been chartered for 2020. Unfortunately for DHT (and luckily for the people renting the boats), these rates are fixed so DHT cannot raise the prices even though demand is high. The annual report tells us that the 2020 revenues from the time-charters will be \$47.4m. I divided this by the four boats that will be chartered for all of 2020 (the DHT Lotus will only be chartered until Q1), then divided by 365 to estimate the daily rate for these four ships. The result comes to about \$32,000 a day.
On April 1 2020, DHT announced time charters for another 6 VLCCs. These time charters are all for 12 months with a daily rate of \$67,300. As we can see, this is more than double the daily rate of the existing charters, though this premium is not entirely due to supply and demand – you would expect longer contracts to have a cheaper daily rate because it reduces risk for DHT.
Spot charters
Sadly, once we have dealt with the time charters, things become a lot more difficult. This is because the spot charter rate depends on supply and demand – if everybody wants to charter a ship, DHT can raise the daily rates. We will model the situation as follows. Because of the WTI supply glut, there will be a certain number of high-demand days for which people will be willing to pay the high-demand daily rate. For the rest of the year, we use the low-demand daily rate.
We may further assume that the low-demand daily rate will be similar to what it was last year. We are told that in 2019 there was \$478m in revenue from spot chartering (between 22 ships), i.e an average daily rate of \$60,000. Hence the two key variables are the number of high-demand days and the high-demand daily spot rate. This is where the estimates start getting pretty subjective, but we will later do a sensitivity analysis that somewhat mitigates this.
I’ve been reading about people trying to hire tankers for storage since at least mid-March, so we know that the number of high-demand days is going to be greater than 30. A quick look at the futures curve shows that the storage cost is going to be very high for the month of May and possibly even June. Let’s err on the side of caution and say that there are 60 days of high demand.
Now for the hardest part – how do we quantify what “high demand” means in terms of the spot rate? Well we, know that in 2019 the average spot rate was about \$60,000 compared to \$30,000 for the time charter. The most recent time-charter had a rate of \$67,300, so assuming 2019’s time:spot ratio holds in 2020, an initial estimate of the spot rate is about \$130k. However, this was on April 1st, about 3 weeks before the extent of the supply constraints came to a head with negative oil. A number of different sources (not particularly credible) estimate a spot rate of over \$200k a day.
With these assumptions, we can build a simple table adding up the revenue from each VLCC. As a baseline, I am using CapIQ’s consensus revenue estimate of \$646m (updated as of 21st April), which is 20% higher than 2019’s revenue.
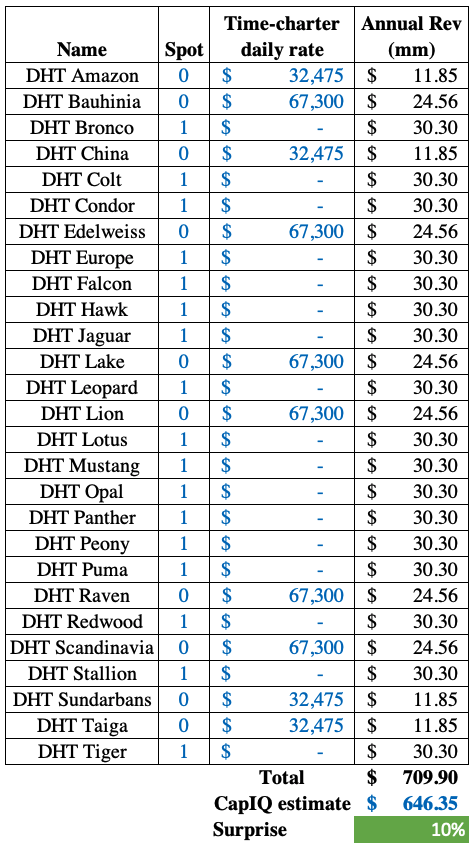
It’s nice to see that our forecasted revenue is in the same ballpark as the CapIQ consensus estimate (if it were 10x higher or lower, it’d be more likely that we were doing something wrong).
The futures curve and the market-implied cost of carry
In the initial analysis, we gave a very haphazard estimate of the high-demand spot charter rate. Let’s see if we can do a little bit better by examining the futures curve for oil:
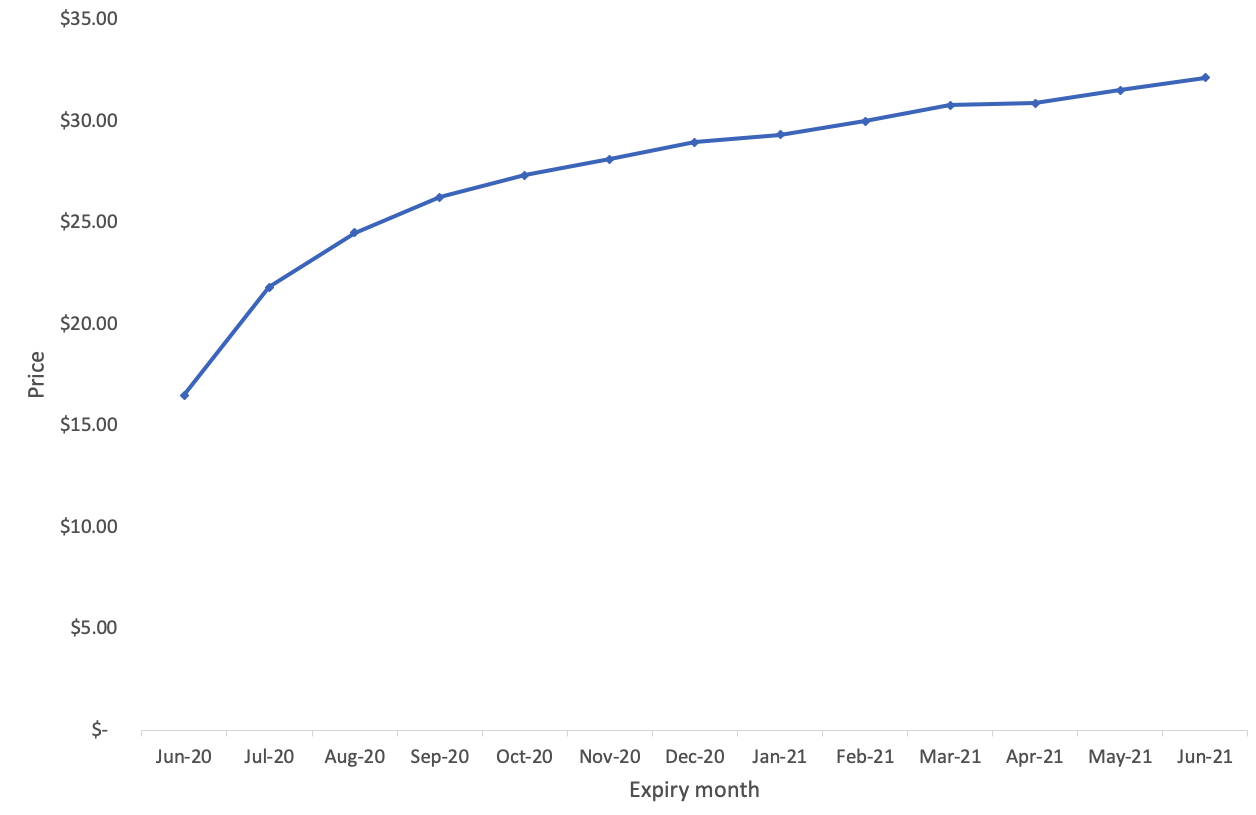
The curve is said to be “in contango” because it is sloping upwards – this is associated with the cost of carry (the cost of storing the underlying), because you’d be willing to pay a little more (or in these times, a lot more) to avoid having to hold the physical oil.
Now for some maths. Let’s say the cost of carry is $s$ per year (expressed as a percentage). So if $s=0.10$ and the oil costs \$20 a barrel, the storage cost is $2 a year. Hence by a simple no-arbitrage argument, the price F of a futures contract expiring 1 year from now relative to the spot price $S_0$ is:
\[F = S_0 (1+s)\]This is called a no-arbitrage argument because if it weren’t true, you could make a risk-free arbitrage profit. Note that I am ignoring the interest rate because it is so low (money printer go brrrr). With the above formula, we see that the implied storage cost (in dollars) between any two months is the price difference of their futures contracts. For example, as of 24/4/20, the June contract is trading at \$16.48 and the July contract is trading at \$21.80. Hence, a reasonable estimate for the storage cost in June is $\$21.80 - \$16.48 = \$5.32$. I was also interested in calculating the annualised cost of storage for a given month, so derived the formula below, but it’s not relevant to our discussion.
\[\begin{align*} F_1 &= S_0 e^{sT_1} \\ F_2 &= S_0 e^{sT_2} \\ \implies \frac{F_2}{F_1} &= e^{s(T_2 - T_1)} \\ \end{align*}\] \[\implies s = \frac{1}{T_2- T_1} \ln \left(\frac{F_2}{F_1} \right)\]Below is a plot that shows the implied cost of carry for different months, overlayed on the futures curve.
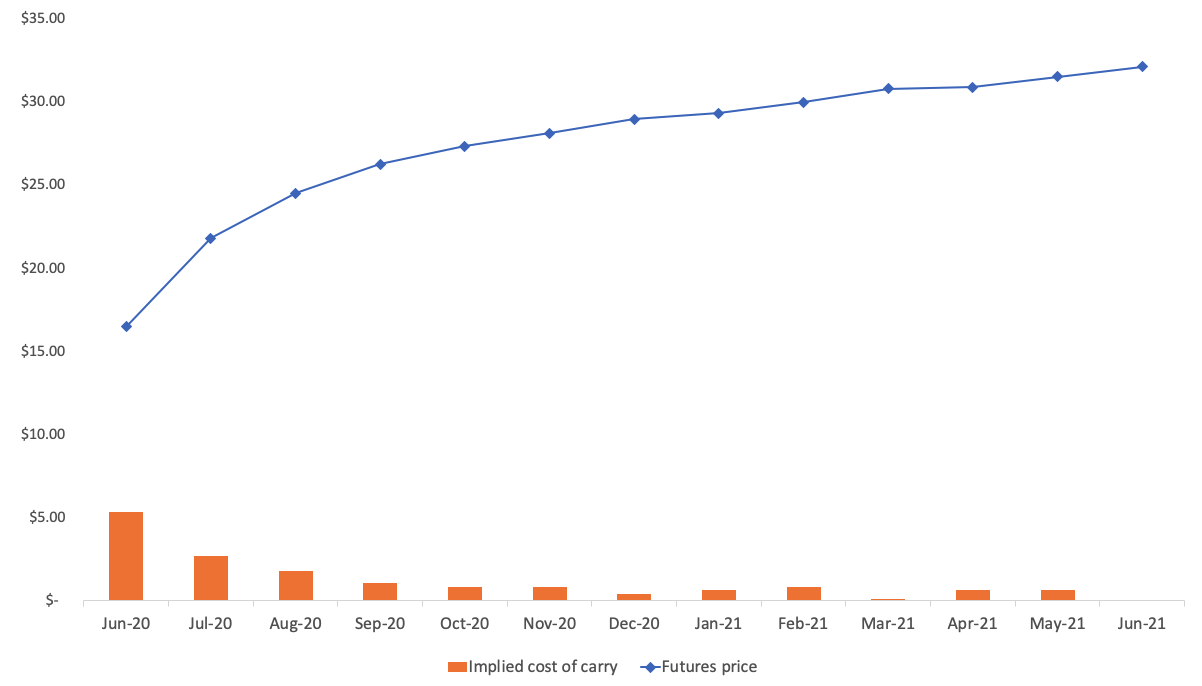
Using the June cost of \$5.32 a barrel, we can put an upper bound on the high-demand spot charter rate. It can be calculated, using the density of oil and the deadweight tonnage, that a VLCC can carry about 2 million barrels of oil. Thus, a cost of carry of \$5.32 per barrel for a month is equivalent to a daily rate of $\$5.32 \times 2 \times 10^6 ~/~ 30 = \$355,000$. This is only an upper bound because in reality there will be a nontrivial cost of freight, so it is not fair to allocate all of the \$5.32 to the cost of the VLCC. In any case, it is nice to see that our initial estimate of \$200k a day lies between our supposed lower and higher bounds. In fact, \$200k seems like quite a conservative estimate for the high-demand rate, because it is the June storage cost. If we calculate the May storage cost based on the settlement price of -\$40, we get the ludicrous spot charter rate of \$3.8m a day. I’m not saying that this is anywhere close to the true May storage cost, but it’s just to illustrate that \$200k is very much on the low end.
The astute reader will note that we could just use each month’s market-implied spot charter rates directly, rather than our unsophisticated “high-demand low-demand” model. However, I think that the current procedure of reverting to the 2019 cost for the low-demand spot rate is more robust and has significantly less model risk, so we’ll stick with that.
Sensitivity analysis
Before we conclude, let’s conduct a sensitivity analysis. This is a critically important part of any model because it emphasises the intrinsic uncertainty of trying to forecast the future. Concretely, we make Excel recompute the quantity of interest (in this case, FY20 revenue) under a range of different values of our two key inputs: the high-demand spot rate and the number of high-demand days.
Because one of the objectives of this exercise is to understand the downside, I have centred the high-demand rates around the initial lower estimate of \$200k. For the high-demand days, we use a range of values from 45 days to 75 days, centred around 60.
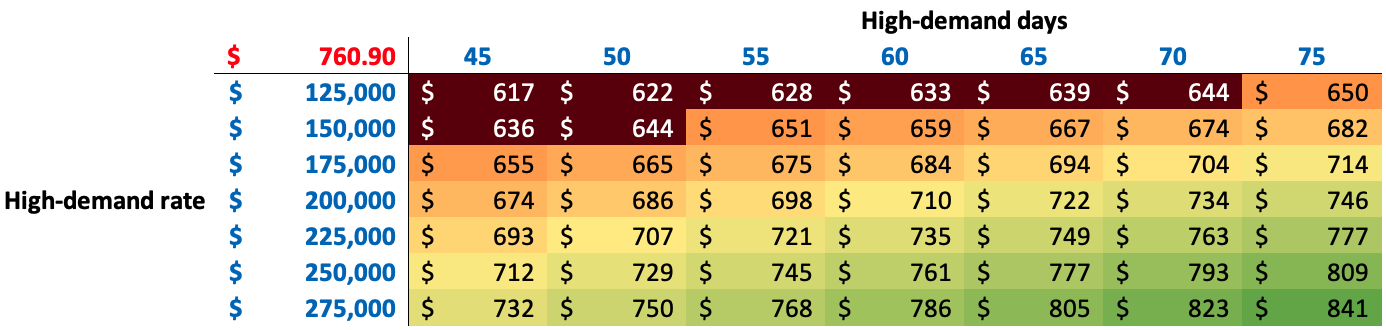
I’ve applied special formatting (dark red with white text) to represent the revenue forecasts that are below the CapIQ estimate. You’ll notice that these are in the top-left as expected, corresponding to a lower spot rate and a shorter period of high demand. However, under a broad range of other assumptions, the model is forecasting positive earnings surprises relative to the CapIQ estimate.
Encore
This section was added a few days after the original post, building on the feedback I received from Reddit.
I posted my initial analysis on Reddit and it generated some nice discussion. Someone pointed out that you can actually find spot charter rates online; in particular, there is a Twitter user that posts nothing but charter details:
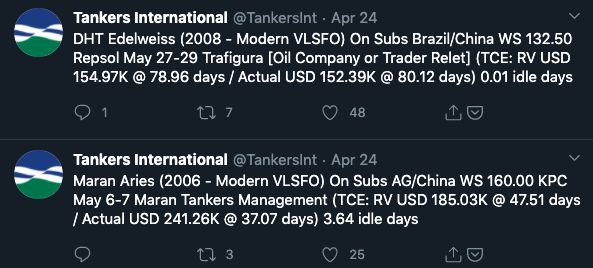
This is very useful because it removes a lot of the subjectivity in our estimation of spot charter rates. To that end, I wrote a python script that does the following:
- Downloads and parses the tweets using
tweepy - Extract the ship name, daily charter rate, the number of days chartered, and start date
- Combine this with the charter data from their annual report and press releases (which I had to input manually)
- Build a pandas dataframe with 365 columns (one for each day) and 27 columns (one for each ship)
- Fill in the data for the days we know
- Output to excel
A section of the spreadsheet is shown below:
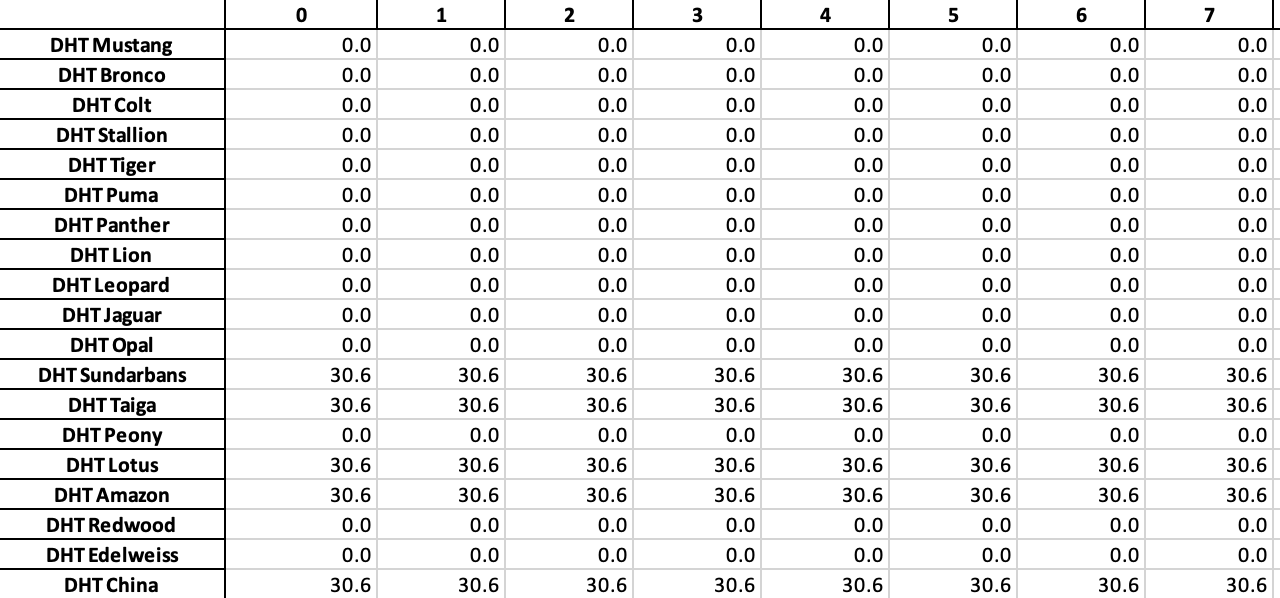
All of the zeros correspond to days for which we don’t have any explicit information. We can then fill these in with whatever estimation model we see fit. Rather than using the two-stage model from before, I’m going to do something much simpler and replace the zeros with the mean charter rate of non-missing entries:
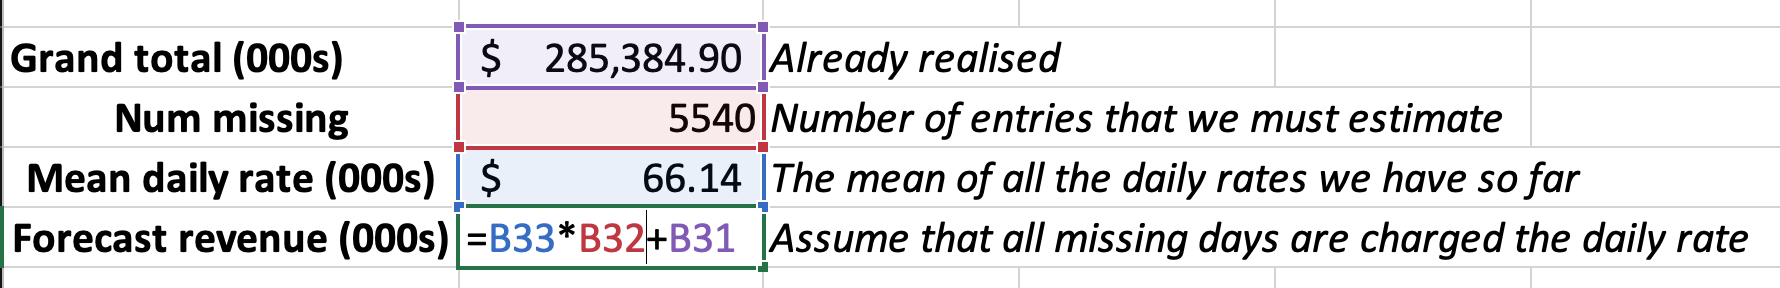
This results in a forecasted 2020 revenue of \$652m, very close to CapIQ’s estimate. I think the true revenue will lie somewhere between this value and the more optimistic forecast from the first model.
Conclusion
In this post, we have built a very simple model for DHT Holdings’ 2020 revenue by combining their fixed time charter rates with our estimates of the spot charter rate, in light of the recent supply glut. Under fairly conservative estimates, I initially forecasted a 10% revenue beat on the upside. However, with more refined data based on actual spot charter rates this year, the CapIQ consensus estimate seems fair.
There are many variables that I have conveniently chosen to ignore. For example:
- Freight, which we mentioned but didn’t quantify, may be quite expensive. Rail freight costs about \$5 a barrel, which would constitute the lion’s share of the \$5.23 June cost of carry.
- It takes a couple of weeks to get a VLCC from the Suez to the Texan coast. There may be complications with space at the ports (which may not have enough space to park a huge number of VLCCs).
- There may be secular headwinds, such as the new 2020 International Maritime Organisation regulations regarding fuel sulphur content, which may lower the low-demand spot rate.
- We have deliberately tried to minimise the number of explicit assumptions regarding the direction of the oil market, because it is not an area that I have any edge in.
However, I think that the Excel model nevertheless provides a reasonable starting point for people to input their own estimates, perhaps factoring in the nuances. Besides, the sensitivity analysis is a nice tool to show you how varying your inputs affects the model output, and in this particular case, shows a reasonable margin of safety. I want to emphasise that this post is not a stock pitch; at best, it is a component of a stock pitch. Ultimately, I suggest you put in the time to come up with your own estimates of the different inputs, and in so doing, tell your own story about the company.